Stocks sold off early in the week on disappointing retail sales and industrial production numbers, but they staged a nice bounce on Friday to close out the week. Although some recent data has been disappointing, inflation data continues to show fast improvement, with producer-level inflation coming in lower than expected last week. Additionally, prices-paid components of regional surveys and supply chain data continues to quickly improve. All this matters, as lower inflation opens the door for the Fed to end its aggressive rate-hiking regime (more on this below).
- Large bounces off midterm-election-year lows are normal, and we expect this to happen again in 2023.
- The goods sector, both in consumption and production, may be pulling back as the economy continues to normalize.
- Price pressures continue to ease, and the inflation outlook is good.
- Rental prices are decelerating, and the supply picture indicates this trend will likely continue into 2023.
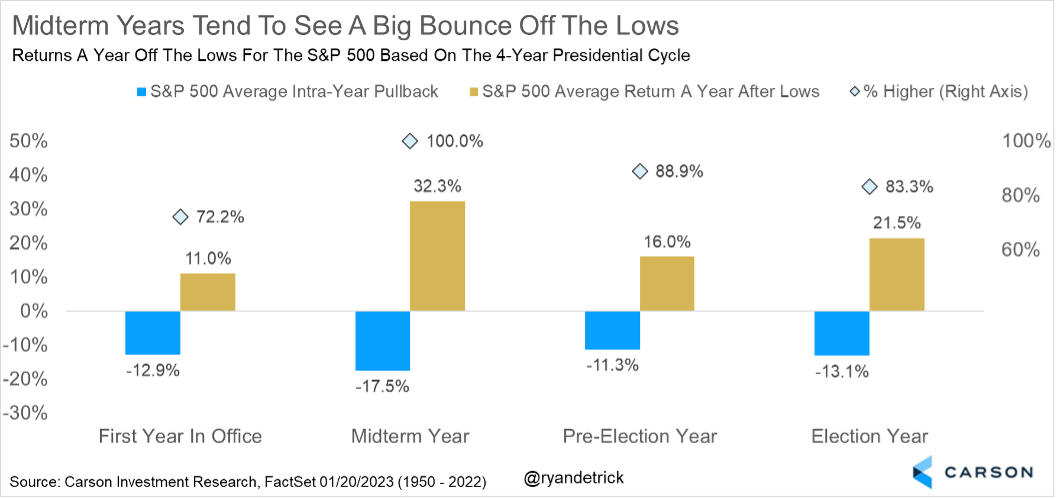
Investors should also take comfort in how strong stocks tend to be one year off a midterm-election-year low. As the chart below shows, midterm years tend to see the largest market corrections, down more than 17% on average. Considering stocks fell more than 25% last year, this scenario played out once again. The good news is stocks tend to see a huge bounce one year off the lows, up 32.3% on average and higher a year later every time. Given the S&P 500 bottomed at 3577.03 on October 12, 2022, a 32.3% bounce would bring the index about 1% away from a new all-time high. As hard as it is to believe that could be possible, history indicates new highs in 2023 aren’t as crazy as they sound.
Good News for Rental Inflation
The Carson Investment Research Team just released its 2023 outlook, which we titled “The Edge of Normal.” The big theme for 2022 was higher-than-expected inflation, which surged to the highest level seen since 1981. This resulted in the Federal Reserve embarking on its most aggressive rate-hike cycle in 40 years, which led to an ugly 2022 for investors, with stocks and bonds falling more than 10%.
However, we are optimistic about 2023, mostly because we believe this year may be disinflationary, with several factors that drove inflation higher last year reversing. Amongst the three major drivers of lower inflation in 2023:
- Gas prices as a deflationary force over the short term;
- A reversal of core goods (ex. food and energy) prices; and
- Shelter inflation pulling back in the back half of the year.
The third leg, i.e., shelter inflation, is probably the most important because that will ultimately drive inflation lower and, most importantly, keep it low. That is especially true for core inflation (ex. food and energy), since shelter makes up 40% of the core CPI basket.
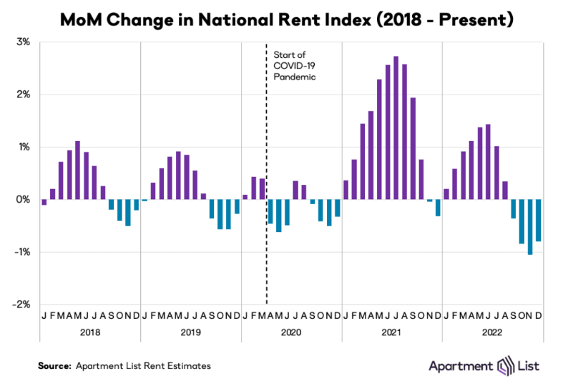
The good news is market rents are decelerating quite rapidly. Data from Apartment List showed rents have declined for four consecutive months. Rents fell 0.8% in December, which is the largest month-over-month decline ever seen in December.
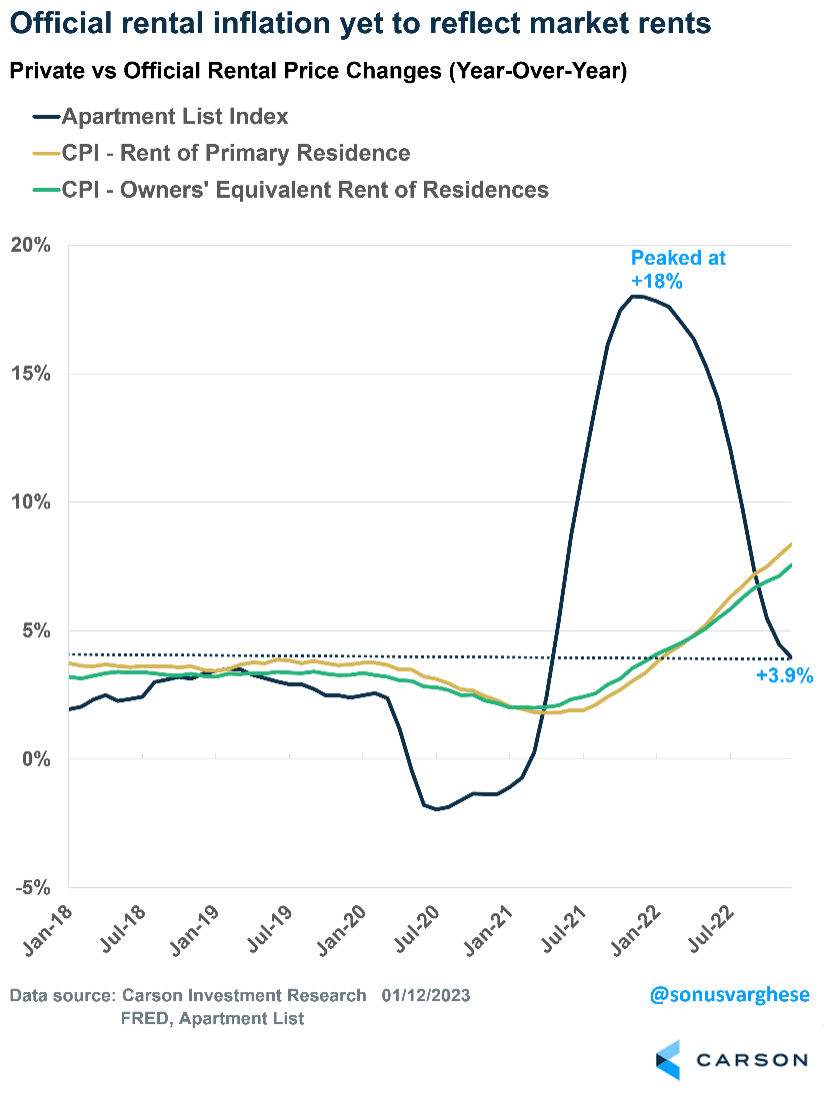
On a year-over-year basis, market rents peaked at 18% at the end of December 2021. The pace was down to under 4% as of last month. Now, as we have discussed in the past, official shelter inflation data is not going to capture this deceleration for another 8-10 months (see here and here). That is because private data reviews only market rents as related to new leases. But renters do not renew their leases every month. So official data considers both existing and new leases, which means there is a lag. On top of that, official data also averages the numbers over several months to smooth them out.
But there is even better news on the horizon for shelter inflation.
More Rental Supply is Coming
The housing data looks awful, thanks to activity cratering amid the surge in mortgage rates. However, this has mostly been concentrated in the single-family housing segment. Dynamics within the multi-family sector have been markedly different.
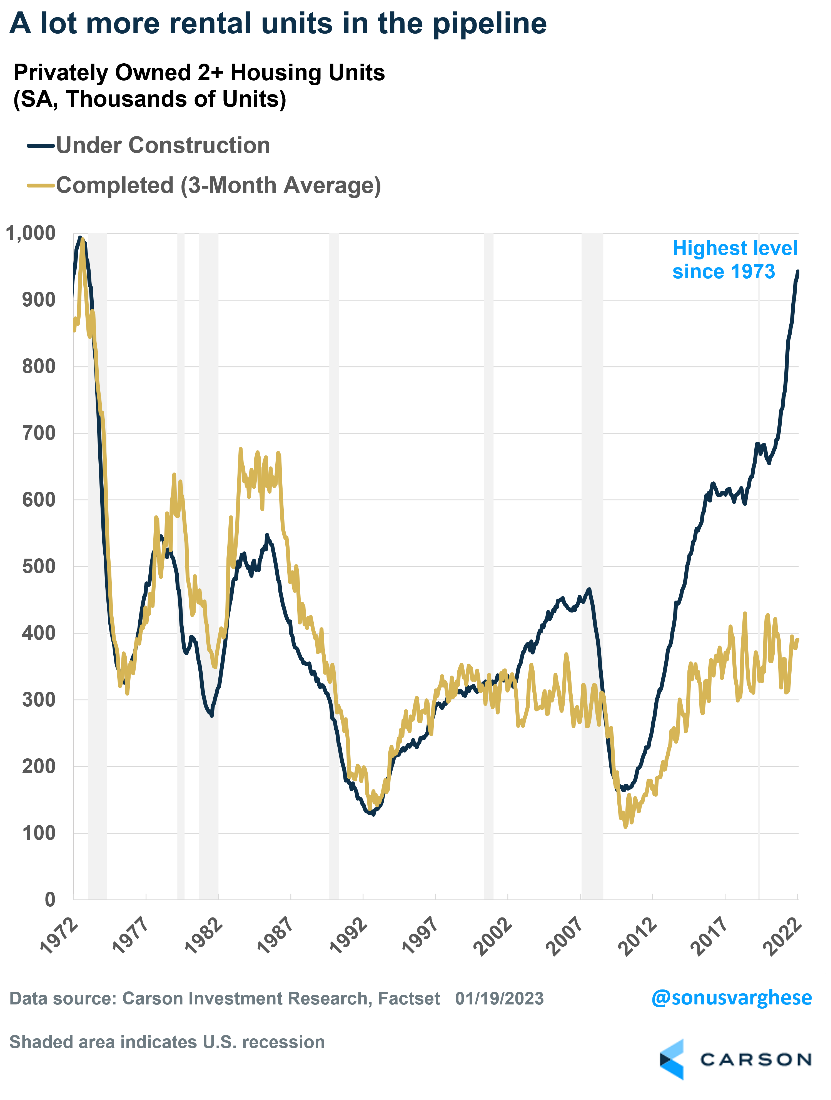
Multi-family units under construction are well outpacing completions and are currently at their highest level since 1973. Typically, construction outpacing completions would be a sign of over-building, as in the mid-2000s amid the housing bubble. This time around, it is due to supply-chain issues and labor shortages. But these are improving.
That means a lot more rental units will come onto the market, perhaps by late 2023 and early 2024. We believe that will put even more downward pressure on rental prices.
Of course, all of this is going to take a while to show up in the official data, but it further strengthens our view that disinflation is coming, with the largest component of the CPI basket, i.e., shelter, driving that downtrend in late 2023 and even into 2024.
Critically, the timing will also likely coincide with a period when the impact of lower goods prices begins to wear off (barring any unexpected shocks). And with shelter inflation on the decline, the Fed will be less likely to argue that disinflationary trends are “transitory.”
As a result, the Fed could start to cut rates in response, although this is unlikely until the very end of 2023, if not early 2024 — unless the economy plunges into recession. But that is not our base case currently, for all the reasons we discuss in our outlook.
This newsletter was written and produced by CWM, LLC. Content in this material is for general information only and not intended to provide specific advice or recommendations for any individual. All performance referenced is historical and is no guarantee of future results. All indices are unmanaged and may not be invested into directly. The views stated in this letter are not necessarily the opinion of any other named entity and should not be construed directly or indirectly as an offer to buy or sell any securities mentioned herein. Due to volatility within the markets mentioned, opinions are subject to change without notice. Information is based on sources believed to be reliable; however, their accuracy or completeness cannot be guaranteed. Past performance does not guarantee future results.
S&P 500 – A capitalization-weighted index of 500 stocks designed to measure performance of the broad domestic economy through changes in the aggregate market value of 500 stocks representing all major industries.
The NASDAQ 100 Index is a stock index of the 100 largest companies by market capitalization traded on NASDAQ Stock Market. The NASDAQ 100 Index includes publicly-traded companies from most sectors in the global economy, the major exception being financial services.
A diversified portfolio does not assure a profit or protect against loss in a declining market.
Sonu Varghese and Ryan Detrick are non-registered associates of Cetera Advisor Networks.
Compliance Case # 01632615


